
- Graduates of Academic Year 2015 and their Employment Status
- Status of Graduates of Academic Year 2015
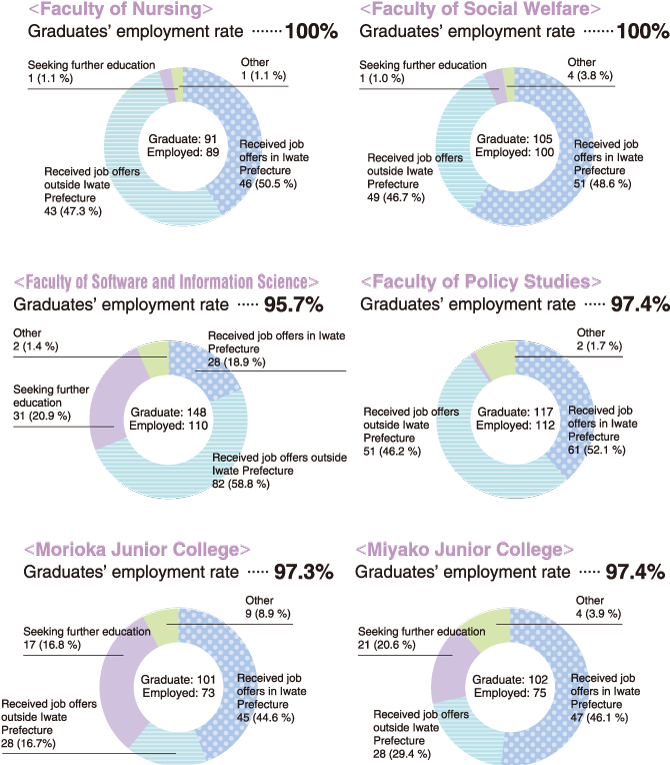
- Career Path Status for Graduates in Academic Year 2015
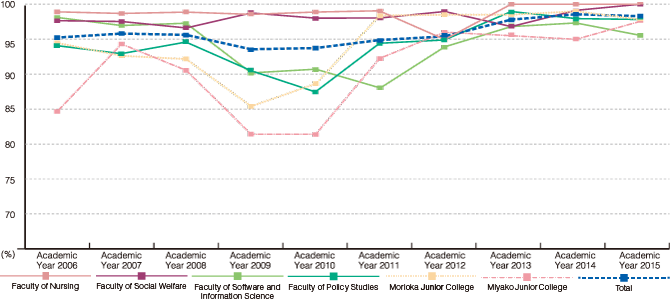
- Employment Offer Rate for the Past Decade Academic Year 2006 - 2015
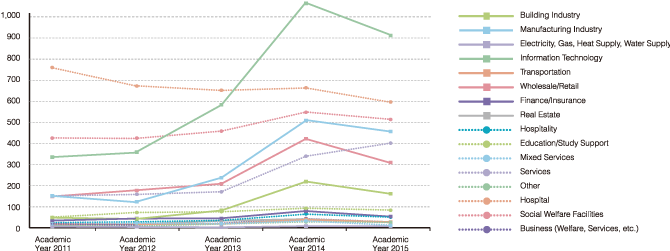
- Status of Employment Offers by Industry over the Past Five Years Construction
- column5:New Approaches for Improvement of Internship Program

In the 2015 Academic Year, we implemented the IPU-E map (student evaluation on employability) and its supplement, the PRG test, for first and second year students across all departments. Additionally, we established the “IPU Committee to Develop Employability” to help promote career education. We made further efforts to encourage students to stay in the local community. With the help of the Employment Supporters, we were able to secure internships with three universities in Iwate, as well as starting an internship program in collaboration with six universities in the Tohoku area. Furthermore, we are holding job fairs featuring local businesses, and providing guidance to parents of students, as well as strengthening civil service exam preparations for all students.
Figures for March 2015 graduates (unit: people)
| Faculties | Faculty of Nursing | Faculty of Social Welfare | Faculty of Software and Information Science | Faculty of Policy Studies | Total | |
|---|---|---|---|---|---|---|
| Graduates | 91 | 105 | 148 | 117 | 461 | |
| Those who found employment | 89 | 100 | 110 | 112 | 411 | |
| Those who found employment (in Iwate) | 46 | 51 | 28 | 61 | 186 | |
| Employment rate | 100 | 100 | 95.7 | 97.4 | 98.1 | |
| Those seeking further education | 1 | 1 | 31 | 0 | 33 | |
| Other | 1 | 4 | 2 | 2 | 9 | |
| Those who completed graduate school | Graduate school of Nursing | Graduate school of Social Welfare | Graduate school of Software and Information Science | Graduate school of Policy Studies | Total | ||||
|---|---|---|---|---|---|---|---|---|---|
| Master’s program | Doctoral Program | Master’s program | Doctoral Program | Master’s program | Doctoral Program | Master’s program | Doctoral Program | ||
| 9 | 1 | 8 | 0 | 31 | 2 | 3 | 0 | 54 | |
| Junior College | Morioka Junior College | Miyako College | ||
|---|---|---|---|---|
| Graduates | 101 | 102 | ||
| Those who found employment | 73 | 75 | ||
| Those who found employment (in Iwate) | 45 | 47 | ||
| Employment rate | 97.3 | 97.4 | ||
| Those seeking further education | 17 | 21 | ||
| Other | 9 | 4 | ||

(Note) Numbers have been rounded off, so there may be cases in which the numbers do not add up to totals.
(Note) “Other” includes those helping around the house, those who started their own business, those who are not seeking employment or further study, those who have not yet decided on a career path and those who have not yet received job offers.
(Note) The “employment rate” is the ratio of those who received job offers to those who seeking employment,based on offers received by Match 31.


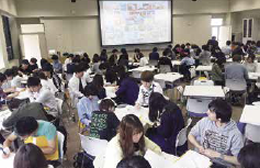
Students split into 30 groups of 4 to discuss their pitch
Our university offices and each academic department work together to focus on career development and employability of each student. The department of Policy Studies requires third year students to take “Career Design II” in the first semester. The core theme of the course is “Working with teammates to solve an issue which has no one correct answer”, and is designed to cultivate student employability that will be relevant in real life. Since the 2015 academic year, the University has collaborated with the local business, Fezan Shopping Center, adopting new local-product development as course projects two years in a row. For the 2016 school year, students have been working to develop a new product of the existing “Kamome no Tamago” for Ofunato’s confectionary, Saito Seika corporation, over the course of 12 weeks. We invited the R&D manager to speak to the class, and all 120 students unleashed their creativity in first creating individual pitches. Halfway through the course, the class was split into groups of four. The groups reviewed each other’s individual pitches and produced a group project incorporating strengths of each. At the end, all 30 teams took the stage in the auditorium to deliver their group presentations, gaining practice in public speaking. These ideas, refined through this process will be adopted and sold in stores in 2016.