- Admission Status for Academic Year 2016
- Admission Policy
- Enrollment Rate for Academic Year 2016
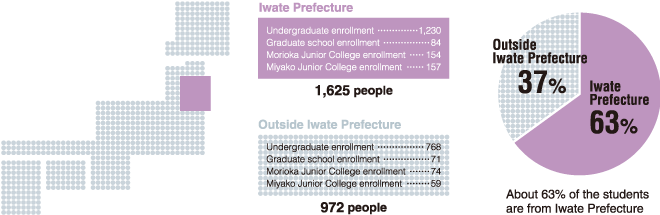
- Home Prefectures of Students in Academic Year 2016
- Admission Results for Academic Year 2016
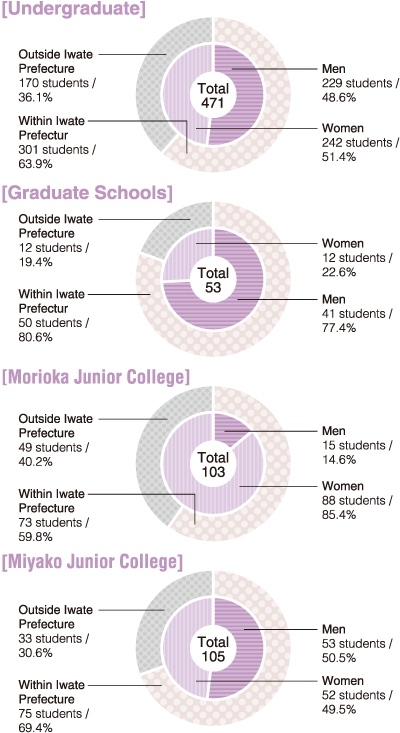
- Breakdown of Students Admitted in Academic Year 2016
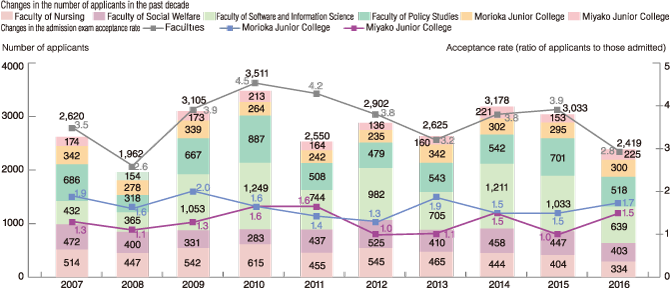
- Admission Status over the Past Ten Years
We continued to take measures in order to secure the number of applicants in the 2015 Academic Year as we assessed various challenges
around the entrance examination and evaluated the examination system as well as holding events such as the High School and University
Collaboration in cooperation with the Association of Iwate Prefecture High School Principals.
In terms of the Project of High School and University Collaboration and the public relations activities of the entrance examination, on top
of usual University Guidance and Consultation Fairs, we also held additional Consultation Fairs for Entrance Examination for parents of
high school students at 5 locations in Iwate Prefecture. In Morioka, we conducted new bus tours that drive around the campus.
At an Open Campus that was held several times of a year, there were exhibitions to introduce the campus life of students as well as a few
events such as a workshop by students of IPU and high schools in various manners.
We also tried to appeal to the applicants in various manners,for instance enhancing advertising activities such as holding a campus tour and
visiting high schools,by a campus attendant,having lectures at high schools in and out of Iwate prefecture and holding touring sessions of the
university.
The admission policy of Iwate Prefectural University is based on the founding principles and objectives of the school.
Student We Seek
Those who agree with founding principles and objective of Iwate Prefectural University, and merit being nurtured as “independent individuals with highly specialized skills and knowledge, deep intelligence, and rich sensitivity”.
(As of May 1, 2016)
| Undergraduate Schools | Faculty of Nursing | Faculty of Social Welfare | Faculty of Software and Information Science | ||||||
|---|---|---|---|---|---|---|---|---|---|
| Quota | Actual enrollment |
Enrollment rate (%) |
Quota | Actual enrollment |
Enrollment rate (%) |
Quota | Actual enrollment |
Enrollment rate (%) |
|
| 380 | 383 | 100.8% | 380 | 415 | 109.2% | 660 | 726 | 110.9% | |
| Undergraduate Schools | Faculty of Policy Studies | Total | |||||||
|---|---|---|---|---|---|---|---|---|---|
| Quota | Actual enrollment |
Enrollment rate (%) |
Quota | Actual enrollment |
Enrollment rate (%) |
||||
| 420 | 468 | 111.4% | 1,840 | 1,998 | 108.6% | ||||
| Graduate Schools | Graduate School of Nursing | Graduate School of Social Welfare | Graduate School of Software and Information Science | ||||||
|---|---|---|---|---|---|---|---|---|---|
| Quota | Actual enrollment |
Enrollment rate (%) |
Quota | Actual enrollment |
Enrollment rate (%) |
Quota | Actual enrollment |
Enrollment rate (%) |
|
| Master’s Program | 30 | 15 | 50.0% | 30 | 9 | 30.0% | 80 | 79 | 98.8% |
| Doctoral Program | 15 | 15 | 100.0% | 9 | 15 | 166.7% | 30 | 13 | 43.3% |
| Graduate Schools | Graduate School of Policy Studies | Total | |||||||
|---|---|---|---|---|---|---|---|---|---|
| Quota | Actual enrollment |
Enrollment rate (%) |
Quota | Actual enrollment |
Enrollment rate (%) |
||||
| Master’s Program | 30 | 4 | 13.3% | 170 | 107 | 62.9% | |||
| Doctoral Program | 15 | 5 | 33.3% | 69 | 48 | 69.6% | |||
| Junior Colleges | Morioka Junior College | Miyako College | |||||||
|---|---|---|---|---|---|---|---|---|---|
| Quota | Actual enrollment |
Enrollment rate (%) |
Quota | Actual enrollment |
Enrollment rate (%) |
||||
| 200 | 228 | 114.0% | 200 | 216 | 108.0% | ||||
(As of May 1, 2015)
Unit: Students; ratio of applicants to those accepted
| Undergraduate schools | Space available | Number of applicants | Number of examinees | Number accepted | Acceptance rate | |
|---|---|---|---|---|---|---|
| Faculty of Nursing | 90 | 334 | 219 | 99 | 2.2 | |
| Faculty of Social Welfare | 90 | 403 | 309 | 104 | 3.0 | |
| Department of Social Welfare | 50 | 180 | 133 | 55 | 2.4 | |
| Department of Human Welfare | 40 | 223 | 176 | 49 | 3.6 | |
| Faculty of Software and Information Science | 160 | 639 | 479 | 181 | 2.6 | |
| Faculty of Policy Studies | 100 | 518 | 388 | 115 | 3.4 | |
| Total | 440 | 1,894 | 1,395 | 499 | 2.8 | |
| Undergraduate schools (transfers) | Space available | Number of applicants | Number of examinees | Number accepted | Acceptance rate | |
|---|---|---|---|---|---|---|
| Faculty of Nursing | 10 | 15 | 15 | 4 | 3.8 | |
| Faculty of Social Welfare | 10 | 18 | 18 | 6 | 3.0 | |
| Department of Social Administration | 5 | 12 | 12 | 5 | 2.4 | |
| Department of Clinical Social Services | 5 | 6 | 6 | 1 | 6.0 | |
| Faculty of Software and Information Science | 10 | 11 | 11 | 9 | 1.2 | |
| Faculty of Policy Studies | 10 | 16 | 16 | 9 | 2.1 | |
| Total | 40 | 60 | 60 | 28 | 2.1 | |
| Graduate schools | Space available | Number of applicants | Number of examinees | Number accepted | Acceptance rate | |
|---|---|---|---|---|---|---|
| Graduate Program in Nursing | 20 | 9 | 9 | 8 | 1.1 | |
| Graduate Program in Social Welfare | 18 | 11 | 11 | 6 | 1.8 | |
| Graduate Program in Software and Information Science | 50 | 40 | 40 | 37 | 1.1 | |
| Graduate Program in Policy Studies | 20 | 3 | 3 | 3 | 1.0 | |
| Total | 108 | 63 | 63 | 54 | 2.1 | |
| Morioka Junior College | Space available | Number of applicants | Number of examinees | Number accepted | Acceptance rate | |
|---|---|---|---|---|---|---|
| Life Science Department | 50 | 153 | 121 | 63 | 1.9 | |
| Major in Life Science | 25 | 67 | 52 | 30 | 1.7 | |
| Major in Food and Nutrition | 25 | 86 | 69 | 33 | 2.1 | |
| Department of International Cultural Studies | 50 | 147 | 117 | 81 | 1.4 | |
| Total | 100 | 300 | 238 | 144 | 1.7 | |
| Miyako College | Space available | Number of applicants | Number of examinees | Number accepted | Acceptance rate | |
|---|---|---|---|---|---|---|
| Department of Business Management and Information Science | 100 | 225 | 209 | 142 | 1.5 | |
* Acceptance rate=Number of examinees÷Number accepted
※Excludes transfers and graduate students.