- Admission Status for Academic Year 2014
- Admission Policy
- Enrollment Rate for Academic Year 2014
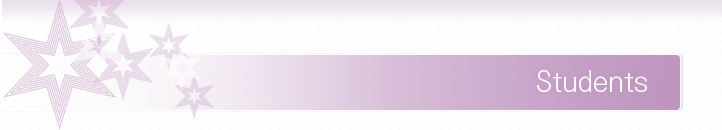
- Home Prefectures of Students in Academic Year 2014
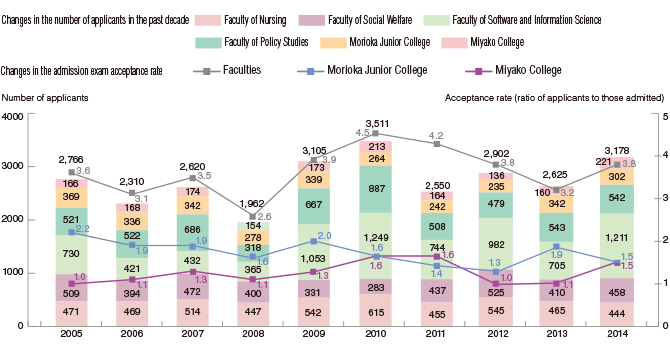
- Admission Results for Academic Year 2014
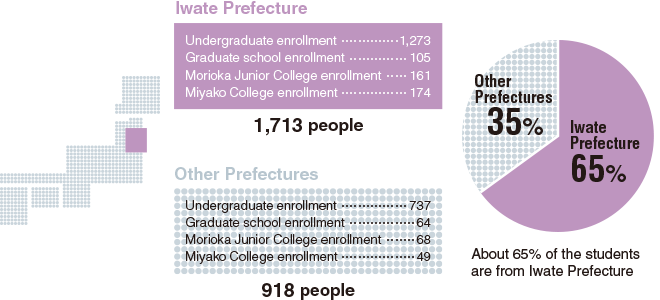
- Breakdown of Students Admitted in Academic Year 2014
- Admission Status over the Past Ten Years
We took a measure to acquire the number of applicants while taking a look at the various problems around the entrance examination and verified the system of the exam.
In terms of collaboration projects between high schools and the university and publicity activities for entrance exam, we added Hakodate district as the participating area of explanation and consultation meeting for admission to the university and held the briefing session for the parents of freshman high school students. Moreover, new attractive events for high school students were implemented at the several open campus events throughout the year. We also tried to appeal to the applicants with updating the contents of event such as a campus tour by a campus attendant, advertising activity like visiting for high schools, and having the visiting lectures at high schools and university touring sessions.
The admission policy of Iwate Prefectural University is based on the founding principles and objectives of the school.
Student We Seek
Those who agree with founding principles and objective of Iwate Prefectural University, and merit being nurtured as “independent individuals with highly specialized skills and knowledge, deep intelligence, and rich sensitivity”.
(As of May 1, 2014)
| Undergraduate Schools | Faculty of Nursing | Faculty of Social Welfare | Faculty of Software and Information Science | ||||||
|---|---|---|---|---|---|---|---|---|---|
| Quota | Actual enrollment |
Enrollment rate (%) |
Quota | Actual enrollment |
Enrollment rate (%) |
Quota | Actual enrollment |
Enrollment rate (%) |
|
| 380 | 374 | 98.4% | 380 | 429 | 112.9% | 660 | 730 | 110.6% | |
| Undergraduate Schools | Faculty of Policy Studies | Total | |||||||
|---|---|---|---|---|---|---|---|---|---|
| Quota | Actual enrollment |
Enrollment rate (%) |
Quota | Actual enrollment |
Enrollment rate (%) |
||||
| 420 | 477 | 113.6% | 1,840 | 2,010 | 109.2% | ||||
| Graduate Schools | Graduate School of Nursing | Graduate School of Social Welfare | Graduate School of Software and Information Science | ||||||
|---|---|---|---|---|---|---|---|---|---|
| Quota | Actual enrollment |
Enrollment rate (%) |
Quota | Actual enrollment |
Enrollment rate (%) |
Quota | Actual enrollment |
Enrollment rate (%) |
|
| Master’s Program | 30 | 18 | 60.0% | 30 | 24 | 80.0% | 80 | 80 | 100.0% |
| Doctoral Program | 15 | 12 | 80.0% | 9 | 14 | 155.6% | 30 | 13 | 43.3% |
| Graduate Schools | Graduate School of Policy Studies | Total | |||||||
|---|---|---|---|---|---|---|---|---|---|
| Quota | Actual enrollment |
Enrollment rate (%) |
Quota | Actual enrollment |
Enrollment rate (%) |
||||
| Master’s Program | 30 | 4 | 13.3% | 170 | 126 | 74.1% | |||
| Doctoral Program | 15 | 4 | 26.7% | 69 | 43 | 62.3% | |||
| Junior Colleges | Morioka Junior College | Miyako College | |||||||
|---|---|---|---|---|---|---|---|---|---|
| Quota | Actual enrollment |
Enrollment rate (%) |
Quota | Actual enrollment |
Enrollment rate (%) |
||||
| 200 | 229 | 114.5% | 200 | 223 | 111.5% | ||||
(As of May 1, 2014)
Unit: Students; ratio of applicants to those accepted
| Undergraduate schools | Space available | Number of applicants | Number accepted | Acceptance rate | |
|---|---|---|---|---|---|
| Faculty of Nursing | 90 | 444 | 94 | 2.9 | |
| Faculty of Social Welfare | 90 | 458 | 107 | 3.4 | |
| Department of Social Welfare | 50 | 196 | 59 | 2.4 | |
| Department of Human Welfare | 40 | 262 | 48 | 4.6 | |
| Faculty of Software and Information Science | 160 | 1,211 | 186 | 4.8 | |
| Faculty of Policy Studies | 100 | 542 | 124 | 3.3 | |
| Total | 440 | 2,655 | 511 | 4.5 | |
| Undergraduate schools (transfers) | Space available | Number of applicants | Number accepted | Acceptance rate | |
|---|---|---|---|---|---|
| Faculty of Nursing | 10 | 12 | 3 | 4.0 | |
| Faculty of Social Welfare | 10 | 22 | 12 | 1.8 | |
| Department of Social Administration | 5 | 11 | 6 | 1.8 | |
| Department of Clinical Social Services | 5 | 11 | 6 | 1.8 | |
| Faculty of Software and Information Science | 10 | 10 | 9 | 1.1 | |
| Faculty of Policy Studies | 10 | 34 | 10 | 3.4 | |
| Total | 40 | 78 | 34 | 2.3 | |
| Graduate schools | Space available | Number of applicants | Number accepted | Acceptance rate | |
|---|---|---|---|---|---|
| Graduate Program in Nursing | 20 | 11 | 10 | 1.1 | |
| Graduate Program in Social Welfare | 18 | 18 | 9 | 2.0 | |
| Graduate Program in Software and Information Science | 50 | 39 | 39 | 1.0 | |
| Graduate Program in Policy Studies | 20 | 2 | 2 | 1.0 | |
| Total | 108 | 70 | 60 | 1.2 | |
| Morioka Junior College | Space available | Number of applicants | Number accepted | Acceptance rate | |
|---|---|---|---|---|---|
| Life Science Department | 50 | 162 | 67 | 2.0 | |
| Major in Life Science | 25 | 56 | 32 | 1.4 | |
| Major in Food and Nutrition | 25 | 106 | 35 | 2.4 | |
| Department of International Cultural Studies | 50 | 140 | 81 | 1.2 | |
| Total | 100 | 302 | 148 | 1.5 | |
| Miyako College | Space available | Number of applicants | Number accepted | Acceptance rate | |
|---|---|---|---|---|---|
| Department of Business Management and Information Science | 100 | 221 | 136 | 1.5 | |
※Excludes transfers and graduate students.